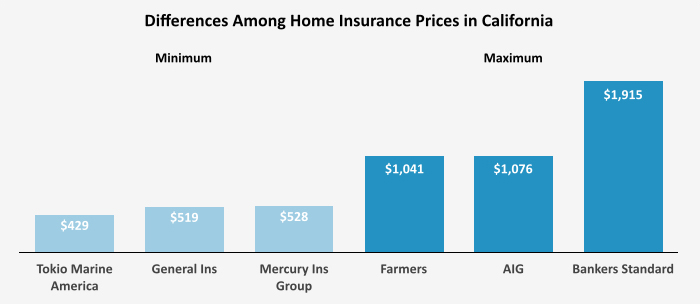
An often overlooked aspect of owning a home is the annual insurance cost. Because the price of a home insurance policy can vary from city to city, researchers for Value Penguin, which provides consumers information on car insurance and credit cards, analyzed data from California’s Department of Insurance, in order to bring greater transparency to these costs. On average, for a sample home, the cost of a one-year insurance policy in California is $773. By studying how prices differ for a single benchmark property across California, consumers will be well informed and better suited to make important financial decisions.
Cheapest Homeowners Insurance in California
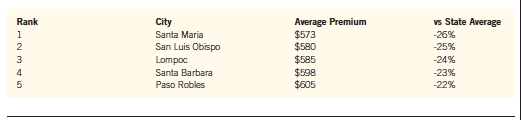
The cheapest places for homeowners insurance was typically $588, 24% below the statewide average, and all are located north of Los Angeles.
| Rank | City | Average Premium | vs State Average |
| 1 | Santa Maria | $573 | -26% |
| 2 | San Luis Obispo | $580 | -25% |
| 3 | Lompoc | $585 | -24% |
| 4 | Santa Barbara | $598 | -23% |
| 5 | Paso Robles | $605 | -22% |
Most Expensive Homeowners Insurance in California
The cities with the most expensive homeowners insurance rates in California are all located in or around Los Angeles. The cost of insuring our benchmark home in these places was $949 per year. Many different factors can account for higher insurance prices – including crime rates, an area’s propensity for extreme weather, labor and construction costs, and more. As a result, it is difficult to accurately pinpoint the exact reason behind one location’s elevated prices.
| Rank | City | Average Premium | vs State Average |
| 1 | Los Angeles | $958 | 24% |
| 2 | Compton | $958 | 24% |
| 3 | Palmdale | $950 | 23% |
| 4 | Lancaster | $945 | 22% |
| 5 | Porter Ranch | $932 | 20% |
Price of Home Insurance in California
Across the 222 cities and towns we surveyed, we found the average price of homeowners insurance in California to be $773. However, significant variation existed from city-to-city. Certain locations deviated by as much as 26% from the mean. Below you will find all the cities in the study, listed from cheapest to most expensive. The number to the right of each city represents its average annual premium.


